.png)

.png)
.png)

Overall Satisfaction is useful because it provides a quick view of how citizens evaluate a service. But when the score falls, that single measure rarely tells decision-makers whether the problem is difficult access, a slow process, unclear information, service quality, unfair treatment, or an unresolved need. A Citizen Survey designed for improvement should therefore go beyond Satisfaction and measure the parts of the experience that matter to the decision the organisation needs to make.
The short answer is: Satisfaction should be measured, but it should rarely be the only measure.
Overall Satisfaction provides a useful summary of the service experience. But if the score is low, that number alone does not tell decision-makers whether the problem is difficult access, a long wait, confusing information, poor service quality, unfair treatment, or failure to resolve the citizen’s need.
The OECD notes that satisfaction indicators can provide a useful aggregate view of service performance, but additional measures are needed to monitor Access,
Responsiveness and Quality and to identify concrete areas for improvement.
The starting point for a Citizen Survey should therefore not be “How many Satisfaction questions should we ask?” It should be “What decision should this survey help us make?”
Satisfaction gives the headline, but not always the reason behind it
Overall Satisfaction summarises how citizens evaluate a service, but it does not explain every factor behind the score. A survey designed for service improvement should examine access, ease and speed, service quality, fairness, responsiveness to feedback, and the outcome received by the user. Population and Sample also matter: a survey of people who successfully used a service may miss citizens who were unable to access it in the first place.
What does Satisfaction actually tell us?
Satisfaction is primarily a Perception Metric. It captures how respondents evaluate a service or experience.
For public services, this can be useful for tracking overall perceptions and comparing results across time, groups or services when definitions, samples and measurement approaches are sufficiently consistent.
The OECD notes that public service satisfaction reflects aspects such as Accessibility, Responsiveness and Quality, while also being influenced by expectations, past experiences and individual characteristics.
Satisfaction is therefore useful evidence, but it should not be used as a substitute for every dimension of Service Performance.
What should a Citizen Survey measure beyond Satisfaction?
There is no single questionnaire that fits every public service. But for a survey intended to support service improvement, at least six dimensions are worth considering.
1. Access: Can citizens actually reach and use the service?
Before asking whether people were satisfied, find out whether those who needed the service could access it.
Relevant questions may include:
- Was information about the service easy to find?
- Did people know where or how to apply?
- Could they use their preferred Online or Offline channel?
- Were there barriers related to distance, time, cost or Digital Access?
- Did some population groups experience greater access barriers than others?
The UN methodology for SDG Indicator 16.6.2, which measures satisfaction with people’s last experience of public services, includes service attributes such as Accessibility, Affordability, Equal Treatment, Effective Delivery and Timeliness alongside Overall Satisfaction.
This matters because people who cannot access a service may never appear in a survey conducted only among people who successfully used it.
2. Ease and Speed: Is the process simple and timely?
Citizens may appreciate staff support while still finding the process slow, repetitive or difficult.
Useful measures may include:
- Ease of the process
- Waiting Time
- Clarity of instructions
- Amount of information or documentation required
- Number of contacts needed
- Ease of using Digital Services
In the OECD Survey on Drivers of Trust in Public Institutions 2025, satisfaction with Speed and Ease of Access showed particularly strong associations with Overall Satisfaction among recent users of administrative services. The OECD cautions that these statistical relationships should not automatically be interpreted as causal effects.
That is why an overall score becomes more actionable when the survey also measures what may sit behind it.
3. Service Quality: What happened during the service experience?
Quality does not need to be reduced to a single broad question.
Depending on the service, a survey may examine:
- Accuracy of information
- Clarity of explanations
- Staff competence
- Courtesy and respectful treatment
- Consistency of service delivery
- Ability to resolve the issue
- Suitability of the service channel
The OECD’s 2025 survey assessed several individual service aspects among recent users, including Courtesy, Competence, Clarity of Information, Ease of Obtaining the Service, access through the preferred channel and Ease of Digital Services.
4. Fairness: Do citizens feel that they are treated fairly?
A service can be fast but still create a poor experience if users feel that treatment is inconsistent or unfair.
Relevant questions may cover:
- Equal Treatment
- Clarity of eligibility or decision criteria
- Perceived neutrality of staff
- Transparency of the process
- Respectful treatment
Fairness appears in both OECD work on public service experience and the UN methodology for SDG Indicator 16.6.2.
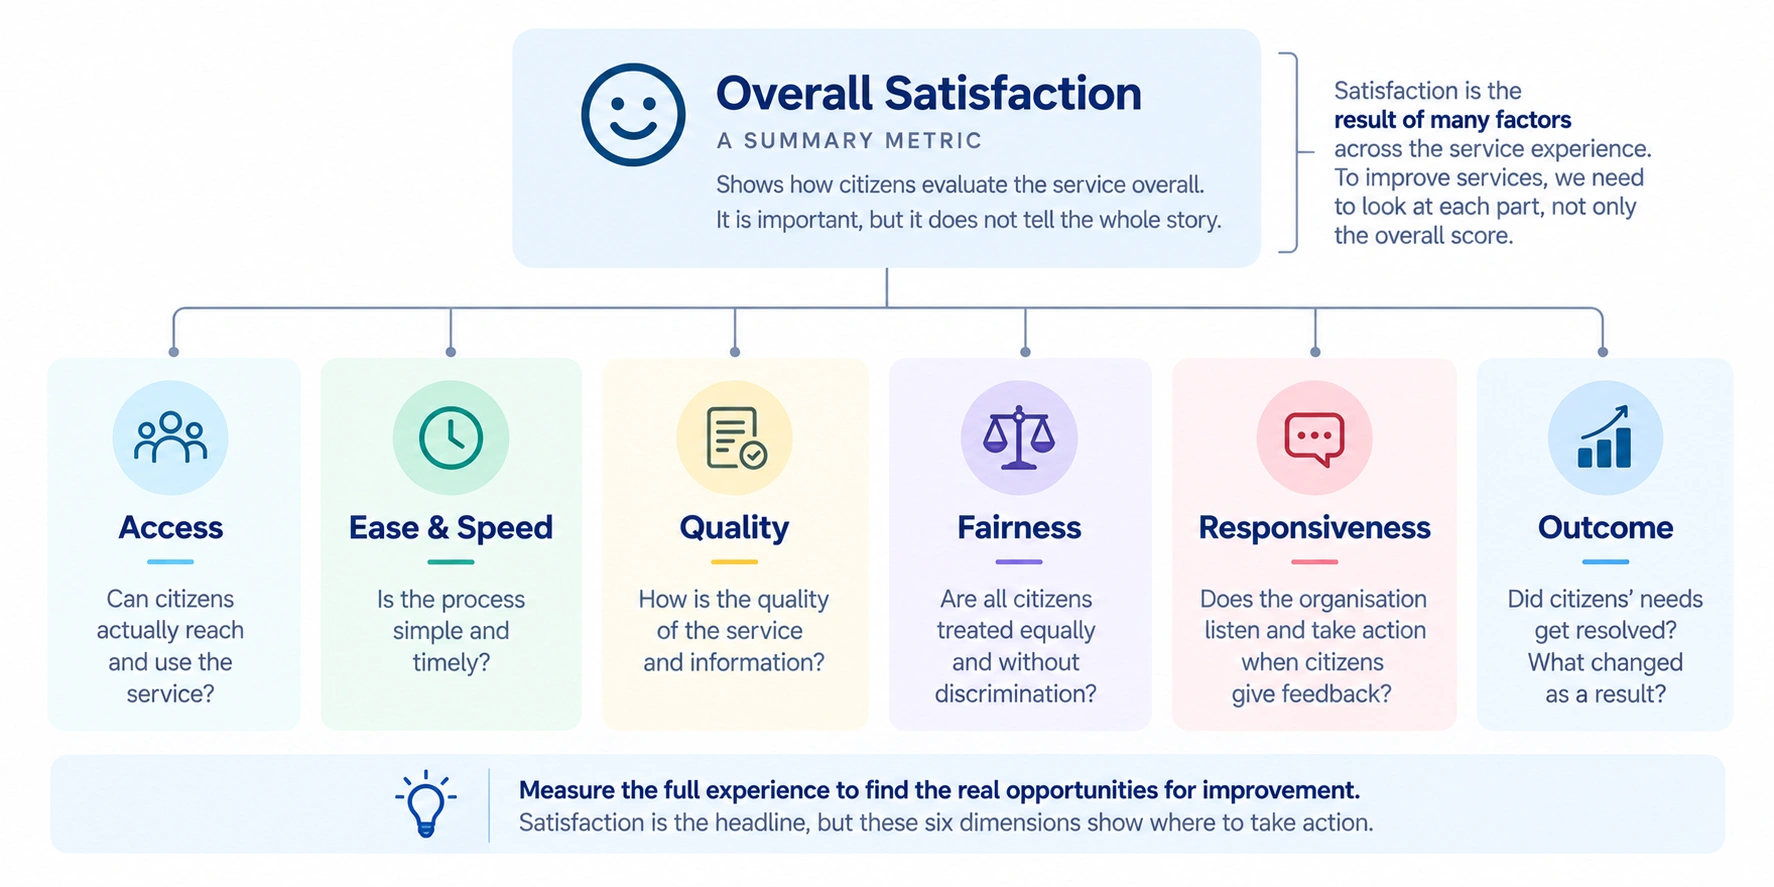
Image suggestion: Insert one simple framework here with Overall Satisfaction at the top and six dimensions underneath: Access, Ease & Speed, Quality, Fairness, Responsiveness and Outcome. The visual should make clear that Satisfaction is a Summary Metric, not the whole measurement system.
5. Responsiveness: What happens when something goes wrong?
An important part of the citizen experience happens when normal service delivery fails.
A survey may ask:
- Did the user experience a problem?
- Was it easy to report or complain?
- Did the organisation respond?
- Was the issue resolved?
- How long did resolution take?
- Does the citizen believe feedback will lead to improvement?
The OECD’s 2025 Trust Survey found that roughly four in ten people across OECD countries considered public services likely to respond to complaints and innovative ideas, showing why Responsiveness is useful to examine separately from Overall Satisfaction.
6. Outcome: Did the citizen get the result they needed?
This is one of the dimensions most easily confused with Satisfaction.
A citizen may be satisfied with the staff and process while the original issue remains unresolved. Conversely, a service may achieve the intended result while some parts of the experience remain frustrating.
Outcome measures depend on the purpose of the service, for example:
- Was the required document or benefit received?
- Was the original problem resolved?
- Was the service completed within the intended timeframe?
- Could the citizen use the information or assistance received?
- Did the condition the programme intended to improve actually change?
Experience and Outcome should therefore be measured separately because they answer different questions.
A good survey should define which experience respondents are evaluating
A question such as “How satisfied are you with government services?” may be too broad if respondents have used several different services or are recalling experiences from different periods.
A clearer Reference Experience can reduce ambiguity, for example by asking about the respondent’s most recent use of a specific service within a defined timeframe.
The official UN definition of SDG Indicator 16.6.2 focuses on the proportion of the population satisfied with their “last experience of public services,” while UNDP guidance combines Overall Satisfaction with questions about specific attributes of that experience.
The practical principle is simple: respondents should know which service, which interaction and which period they are being asked to evaluate.
Do not look only at the score. Look at who answered the survey
A well-written questionnaire does not automatically represent the entire citizen population.
If a survey is conducted among people leaving a service centre, it can provide evidence about people who successfully reached that centre. It may tell us much less about people who did not know the service existed, could not travel to it, or abandoned the process before completion.
UNDP guidance for SDG Indicator 16.6.2 uses Nationally Representative Household Surveys when population-level estimates are required.
Before interpreting results, check:
- Who is the Target Population?
- Where did the Sample come from?
- Who had a realistic chance of being selected?
- Which groups may be underrepresented or absent?
- Are subgroup sample sizes sufficient for the comparisons being made?
A large Sample Size does not automatically fix a Coverage Problem if important groups had little or no chance of entering the Sample.
Should the lowest-scoring item always be fixed first?
Not necessarily.
Imagine that Parking receives the lowest score, while Waiting Time and First-contact Resolution have stronger associations with Overall Satisfaction. Parking may still be a real problem, but the lowest score alone does not prove that it should be the first improvement priority.
Prioritisation can consider several factors together:
- Current Performance
- Number of citizens affected
- Relevance to the intended Outcome
- Differences across population groups
- Feasibility and cost of improvement
- Evidence that the factor is associated with the Outcome that matters
Where the data are appropriate, Driver Analysis can help identify which experience factors are associated with Overall Satisfaction or another relevant Outcome. Statistical association, however, should not automatically be treated as causation.
A useful Citizen Survey does not have to be long
Measuring several dimensions does not mean building a very long questionnaire.
Each question should have a reason to exist. What decision, analysis, comparison or action will the answer support?
If nobody knows how a question will be analysed or how the answer might change a decision, it may not need to be included.
A concise survey built around clear Decision Questions can be more useful than a large questionnaire that collects many measures without a clear plan for using them.
A practical structure for a Citizen Survey
- Service Experience: Which service was used, when and through which channel?
- Access: Was information easy to find and the service easy to reach?
- Ease and Speed: Was the process simple, clear and timely?
- Service Quality: Did information, staff and service delivery meet the user’s needs?
- Fairness: Did the user feel they were treated appropriately and equally?
- Responsiveness: If a problem occurred, did the organisation respond and resolve it?
- Outcome: Did the citizen obtain the intended result?
- Overall Satisfaction: Considering the full experience, how satisfied was the user?
- Open-ended Feedback: What should be improved most, and why?
- Classification: Collect only the respondent information needed for meaningful analysis, with appropriate attention to Privacy.
This is not a universal Questionnaire Template. It is a way to check whether each section of the survey supports a real Decision Question.
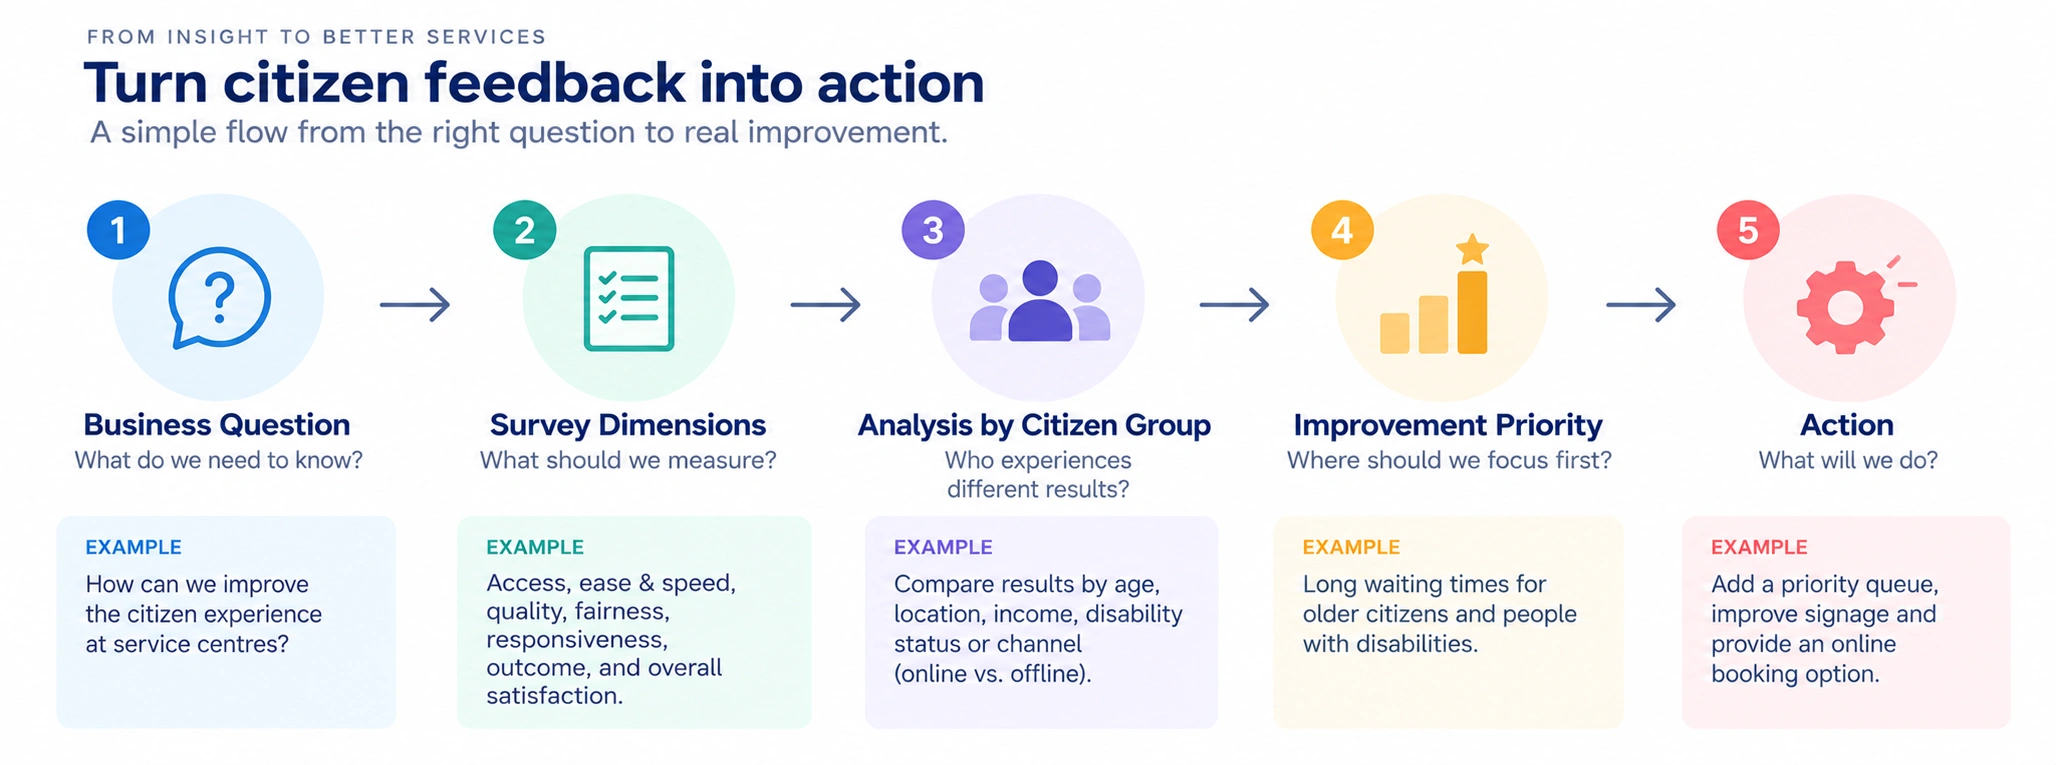
Ask these seven questions before fieldwork begins
- What decision will this survey support?
- Do respondents know exactly which service and experience they are evaluating?
- Are we measuring enough beyond Overall Satisfaction to understand what sits behind the score?
- Does the survey capture Access problems, or only people who successfully reached the service?
- Are Experience and Outcome treated as separate concepts?
- Is the Sample appropriate for the Population we want to describe?
- When the results arrive, do we know how improvement priorities will be identified?
If these questions cannot be answered, adding more survey items may not make the research more useful.
The same principle applies to Customer Surveys in business
Although this article focuses on Citizen Surveys, businesses face the same measurement problem.
If an SME asks customers only whether they are satisfied, a declining score may not reveal whether the issue is Product, Price, Delivery, Staff, Checkout or After-sales Service.
And high Satisfaction does not automatically mean high Repeat Purchase, Retention or Sales.
The useful starting question is the same: “What decision do we need to make, and what information do we need to make it?”
That principle applies to both Public Service Research and Customer Research: start with the Decision, then select the Metrics and questions.
The takeaway: Satisfaction belongs in the survey, but it should not be the whole survey
Overall Satisfaction is useful as a summary measure, but it should not be asked to do the job of an entire measurement system.
A Citizen Survey designed for service improvement should connect Satisfaction with Access, Ease and Speed, Service Quality, Fairness, Responsiveness and Outcome, while also checking whether the Population and Sample support the conclusions being drawn.
The goal is not to ask everything. The goal is to collect the information needed to answer three practical questions: Where is the problem, who is affected, and what should we do next?

Satisfaction should be one measure, not the entire survey. A decision-oriented Citizen Survey should consider at least Access, Ease and Speed, Service Quality, Fairness, Responsiveness, and Outcome, while also checking who is represented in the Sample and whose experience may be missing.
Sources
- OECD. Serving citizens: Measuring the performance of services for a better user experience. Published 30 May 2022.
- OECD. OECD Survey on Drivers of Trust in Public Institutions 2026 Results. Based on the 2025 survey wave.
- OECD and Asian Development Bank. Government at a Glance: Southeast Asia 2025. Satisfaction with public services.
- United Nations Statistics Division. SDG Indicator 16.6.2: Proportion of population satisfied with their last experience of public services. Metadata repository current as of 24 August 2026.
- United Nations Development Programme. SDG Indicator 16.6.2 guidance on public service satisfaction, nationally representative household surveys and service attributes.

.png)
.png)
.png)